
Most statistical analyses of accidents are based on either frequency or severity or both. The standard frequency rate represents the number of disabling injuries for given man-hours of exposure. The standard severity rate is the total time charged as a result of lost time injury for a given number of man-hours of exposure.
Thus the frequency rate indicates how many injuries are occurring in relation to number of man-hours worked and the severity rate indicates how severe those injuries are in terms of wage lost in relation to hours of exposure. The safety engineer is concerned with reducing both frequency with which accident occurs and the frequency with which they threaten.
He wants to know why a man fell off a ladder even if no injurious injuries resulted. The severity rate, which takes into account the extent and severeness of the injuries, is also closely associated with the efficiency of the safety program. If an employee receives laceration and abrasion in falling from a ladder, prompt and adequate medical care will limit this to first aid case, whereas inadequate care maybe results in injections.
Frequency and severity rate vary from one industry to another rate, whereas mining and lumbering are at the opposite extremes. These differences reflect not only the inherent dangers in the industry but also many other factors including the efficiency of the safety program.
An important segment of progressive industrial management saw the fallacies in these concepts and felt that management should do more for the safety of workmen. The social progress of the time was reflected in the development of safety movement which was given in impetus by workman’s compensation laws enacted in most of the industrial countries in the late 19th and early 20th century.
A new concept was inherent in these laws namely that the employer should accept primary responsibility for injuries incurred at work even though they could not be attributed to any one person or cause. Industry became legally liable for injuries to its workers and became obligated to provide benefits during the time lost from work, medical and surgical care and death benefits to dependents. Once it was recognized, that disablement.
Represented a part of the cost of industrial production and which had to be incorporated in the price of product management, a strong incentive for preventing accident came into being. At the same time, workmen compensation laws led to the rapid growth of casualty insurance as a means of furnishing protection to the employer.
The insurance companies collaborated with the industry is playing a major role in accident prevention programs and aiding employers in taking preventive action. Three specialized skills (1) safety engineering (2) industrial hygiene and (3) industrial medicine were deployed as methods of preventing injury to the worker and of reducing costs.
The first two aim at reducing the number of work injuries and disabilities in the occupational setting by removing their causes and the third in concern with minimizing the consequences of injury and disease and with restoring disabled workers of useful employment.
The following statistical ratios or concepts are utilized to measure accidents in industries:
- Frequency Rate (F.R.). The frequency rate is the number of disabling injuries per one million man-hours worked.
Frequency rate=number of disabling injuries/Number of man-hours worked x 1000,000.
Example 1.Using the following data calculate the frequency rate of accident in an industrial plant.
- Number of workers=500
- Number of disabling injuries per year= 5.
- Average number of hours worked by worker per year=2000.
Sol. Frequency rate=numbers of disabling injuries/number of man-hours worked x 1000,000
= 5/500×2000 x 1000000=5. Answer.
2. Severity Rate (S.R.). The severity rate is the total number of days lost or charged due to accidents per one million man-hours worked.
Severity rate= days lost in a year due to accidents/number of man-hours worked x 1000,000.
Here days lost= actual days lost due to accidents + standard number of days considered to be lost depending on nature of disabling injury. The days list figure consists of the actual number of days lost by employees plus a standard number of days charged for loss of limb. Standard number of days lost is correlated to the nature of injury, as for example, standard number of days lost in 35days, the nature of injury being cutting of the tip of a finger, whereas standard number of days lost in 6000 days for a total disability case.
Example 2. Using the following date calculate the severity rate of accident in an industrial plant where only one accident occurred during the year, the type of injury being cutting of the tip of a figure.
- Number of workers=2000.
- Number of days lost in a year due to accidents=100
- Average number of hours worked by worker per year=2000.
Sol. Severity rate=days lost in year due to accidents/number of man-hours worked x 1000,000
Number of man-hours worked in this case=2000 X 2000.
Days lost in year due to accidents=100+35=135.

Using the following data calculate the severity rate of accident in an industrial plant where only one accident occurred during the year involving total disability of a worker.
- Number of workers=2000.
- Number of days lost in a year due to accident=100.
- Average number of hours worked by worker per year=2000.
Sol. Severity rate= days lost in year due to accidents/number of man hours worked x 1000000.
Number of hours worked in this case=2000×2000.
Total disability; days lost=100+6000=6100 days.
Severity rate =6100/2000x2000x1000000= 6100/4=1525.
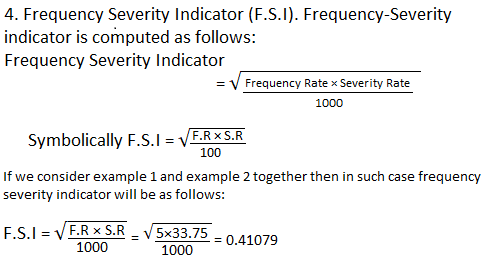
3. frequency-severity rate (FSR). Frequency severity rate is given as follows:
Frequency severity rate = frequency rate x severity rate
Symbolically, F.S.R.=F.R.xS.R.
If we consider example 1 and 2 together then in such case frequency rate will be as follows:
F.S.R.=F.R.x S.R.= 5×33.75=168.75
Now it’s your turn
IF YOU LIKE THIS ARTICLE ( Accident measurement ) PLEASE SHARE TO YOUR SAFETY-PROFESSIONAL FRIENDS.


If there is total disability is more than one, then how to calculate severity rate
SIR
How to calculate the efficiency rate in comparative years on industrial safety ?
You have shared the FR & SR. Thanks for this.
Dear Sir,
My question is – Why we choose 1000000. kindly give me proper answer with data. Interviewer asked me question.
On an average in the company the no of employees would be 500 working 40 hours a week and 50 weeks a year so 500*40*50 = 1,000,000.
As per OSHA Trir and DART are calculated for 100 employees that would be 200,000.
why FR and SR multiply by 1000000
Is it 10 lkhs or 1lhs?
10 lakhs
What is 35 in severity rate
Standard number of days lost in 35days
Good platform for safety knowledge.
Good…..!
Thank You Sir
This is great, thank you sir. I wish you can help me with jha on Pipeline Pigging services